Enhance ext2fs to support preallocation and read ext4 file systems
I have finished FreeBSD SoC 2010 this year. please review ZhengLiu to review next works for ext2fs.
Abstract
During GSoC 2009, Aditya Sarawgi created a GPL-free implementation of ext2fs for FreeBSD, which has now been completed. The project is located in /head/sys/fs/ext2fs/. However the GPL-licensed preallocation code is removed.
This project implements preallocation in ext2fs and update ext2fs to be able to read ext4 file systems and possibly add other functionality, such as write ext4 file systems. The newer versions of ext2fs uses a reservation window mechanism. So this project will implement this mechanism.
Mentor
Acknowledgement
Pedro F. Giffuni
Schedule
This schedule do not determined and need to be reviewed by my mentor
April 12 - April 30: Build development system and learn some knowledge, such as building a development kernel, deeply understanding of VFS, ext2fs project and so on
May 01 - May 15: Implement a reservation window mechanism in ext2fs.
May 16 - May 31: Test the performance using iozone, dbench and so on.
June 1 - June10: Add ext4 file system data structure, such as super block, inode. Maybe it just need to modify some source codes in ext2fs.
June 11 - June 30: Add some functions in vfsops.
June 1 - July 15: Add some functions in vnops and modify ext2fs's source code to able to read ext4 file systems.
July 16 - July 31: Test program.
August 01 - August 15: Improve documentation. if possible, I will try to implement write in ext4 file systems
References
Improving Second Extended File system (ext2fs) and making it GPL free (FreeBSD SoC 2009)
Design and Implementation of the Second Extended Filesystem
Benchmarking
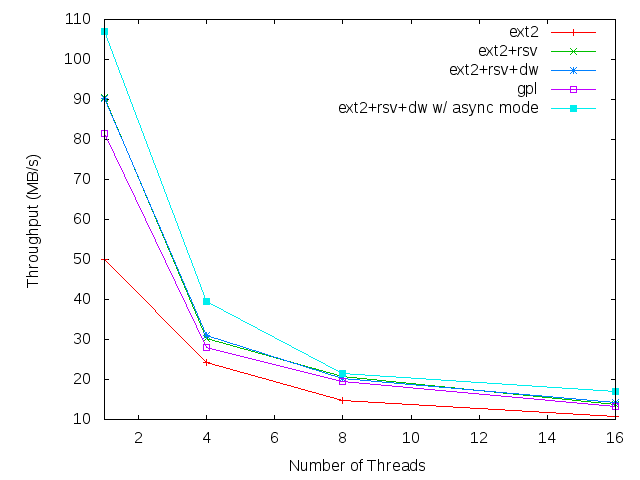
I bought a new computer to run my benchmark. The computer has a Intel E5300 CPU, DDR2 800 2GB memory and a Hitachi 7200 RPM 250GB hard disk. I use ministat tool to calculate statistics data.
'ext2' is current implementation without preallocation. 'ext2+rsv(8)' is my implementation with reservation window, which the size of window is 8. 'ext2+rsv+dw' can dynamically increase the size of window. 'gpl' is a FreeBSD 8.0 implementation with preallocation.'ext2+rsv+dw w/ async' is mounted with 'async' mode.
mke2fs /dev/adX

mount -t ext2fs /dev/adX <mountpoint>
dbench
I run each benchmark 5 times because these benchmark need to run too long time. The measuring unit is MB/s.
dbench -D <mountpoint> <clientnumbers>
Thread 1:
x ext2
+ ext2+rsv
* ext2+rsv+dw
% gpl
# ext2+rsv+dw w/ async mode
    N           Min           Max        Median           Avg        Stddev
x   5       45.5045       51.5541       51.4006       49.9481     2.3945877
+   5       89.6299       91.4174       90.9006      90.57168    0.87129257
*   5       88.9354       91.7832       90.6713      90.32766     1.1425207
%   5        79.444       82.9166       81.1734      81.50848     1.4356841
#   5       104.619       108.499       107.003      106.9168     1.4420129
Thread 4:
x ext2
+ ext2+rsv
* ext2+rsv+dw
% gpl
# ext2+rsv+dw w/ async mode
    N           Min           Max        Median           Avg        Stddev
x   5       21.4515       26.2088       24.8431      24.13024      1.866238
+   5       29.2331       31.0921       30.1673      30.21956    0.71182337
*   5       27.5536       33.2609       31.2595       30.9399     2.2345179
%   5        26.941       29.3204       27.2857      27.96066     1.0999782
#   5       30.9833        43.039        41.071      39.40886     4.8328681
Thread 8:
x ext2
+ ext2+rsv
* ext2+rsv+dw
% gpl
# ext2+rsv+dw w/ async mode
    N           Min           Max        Median           Avg        Stddev
x   5       14.2031       15.3121       14.7745       14.7199    0.42417473
+   5       19.1683        21.509       20.9796      20.70498    0.90620942
*   5         19.86       20.7328       20.3172      20.34836    0.34299175
%   5       18.5462       20.3042       19.3613        19.422    0.71459646
#   5       20.5348        22.519       21.2898      21.42142    0.79828509
Thread 16:
x ext2
+ ext2+rsv
* ext2+rsv+dw
% gpl
# ext2+rsv+dw w/ async mode
    N           Min           Max        Median           Avg        Stddev
x   5       10.1522        10.996       10.6284      10.62836    0.31219525
+   5       12.8946       14.3441       13.5806      13.70512    0.60453204
*   5       13.7096       14.6223       14.2731      14.20036    0.33273137
%   5       12.8018       14.0892       13.2879      13.28362    0.50161008
#   5       16.2873       17.7242       17.2376      17.05444    0.65498857
Blogbench
I run each benchmark 10 times. This result is just a score. So it does't have a measuring unit.
blogbench -d <mountpoint>
Write score:
x ext2
+ ext2+rsv
* ext2+rsv+dw
% gpl
# ext2+rsv+dw w/ async
    N           Min           Max        Median           Avg        Stddev
x  10            29            39            33          32.9     3.0349812
+  10            36            43            37          38.3     2.7507575
*  10            35            44            38          38.2     2.9739611
%  10            31            44            35          35.4      4.376706
#  10            34            50            41          40.1     4.4334586
Read score:
x ext2
+ ext2+rsv
* ext2+rsv+dw
% gpl
# ext2+rsv+dw w async
    N           Min           Max        Median           Avg        Stddev
x  10         38714         67212         49050       49344.2     7644.3012
+  10         38435         60851         49903       48966.5     6510.8627
*  10         45062         68911         50454       51229.2     7278.6375
%  10         61553        100230         70331       73103.6     10791.084
#  10         41226         71295         52230       52605.1     8879.7999
Deprecated Implementation
NOTE: These benchmarks is only for reference.
Reason: The reservation window allocation hit is too low. When the number of threads are not too much (such as less than 4), most of allocation can hit in reservation window. However, When the number of threads are greater than 4, context switch get more frequently. hit ratio gets lower.
Platform
The computer has a Intel E5300 CPU, DDR2 800 2GB memory and a Hitachi 7200 RPM 250GB hard disk. I use ministat tool to calculate statistics data.
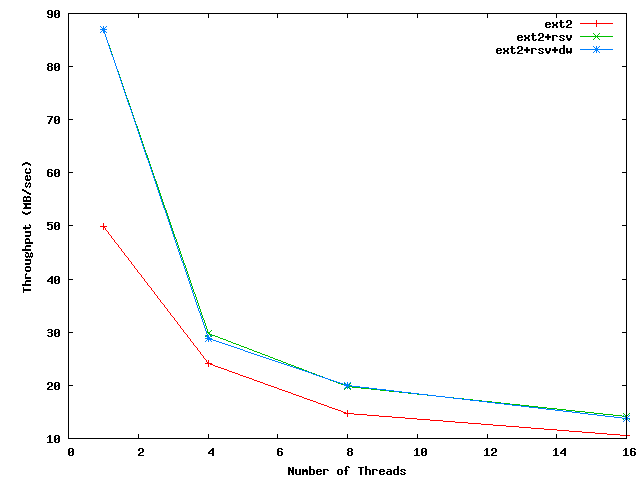
'ext2' is current implementation without preallocation. 'ext2+rsv(8)' is my implementation with reservation window, which the size of window is 8. 'ext2+rsv+dw' can dynamically increase the size of window.
dbench
I run each benchmark 5 times because these benchmark need to run too long time. The measuring unit is MB/s.
dbench -D <mountpoint> <clientnumbers>
Thread 1:
x ext2
+ ext2+rsv
* ext2+rsv+dw
    N           Min           Max        Median           Avg        Stddev
x   5       45.5045       51.5541       51.4006       49.9481     2.3945877
+   5       82.1763       89.3503       88.0009      86.92796     2.8524055
*   5       81.3983       89.4931       88.1687     86.946867     2.8929974
Thread 4:
x ext2
+ ext2+rsv
* ext2+rsv+dw
    N           Min           Max        Median           Avg        Stddev
x   5       21.4515       26.2088       24.8431      24.13024      1.866238
+   5       26.8594       31.9895       29.8409      29.80558     2.0533969
*   5       26.7923       30.9451       28.5845     28.818143     1.6385014
Thread 8:
x ext2
+ ext2+rsv
* ext2+rsv+dw
    N           Min           Max        Median           Avg        Stddev
x   5       14.2031       15.3121       14.7745       14.7199    0.42417473
+   5       17.3095       21.0776       20.4444      19.79332     1.5074286
*   5       17.6481       21.6323       19.8696      19.92342     1.7359695
Thread 16:
x ext2
+ ext2+rsv
* ext2+rsv+dw
    N           Min           Max        Median           Avg        Stddev
x   5       10.1522        10.996       10.6284      10.62836    0.31219525
+   5       10.5891       16.5768       14.2311     14.099983     1.9778735
*   5       10.8098       14.6764       14.0572     13.741214     1.3280996
Blogbench
I run each benchmark 10 times. This result is just a score. So it does't have a measuring unit.
blogbench -d <mountpoint>
Write score:
x ext2
+ ext2+rsv
* ext2+rsv+dw
    N           Min           Max        Median           Avg        Stddev
x  10            29            39            33          32.9     3.0349812
+  10            26            37            32            32     2.7633971
*  10            32            38            34          34.2     1.8593394
Read score:
x ext2
+ ext2+rsv
* ext2+rsv+dw
    N           Min           Max        Median           Avg        Stddev
x  10         38714         67212         49050       49344.2     7644.3012
+  10         38779         70237         45777      47869.25     8839.6211
*  10         42032         65169         46213       48610.4      6169.217
NOTE: This section is deprecated and it is just for reference.
Reason: These benchmark maybe doesn't reflect the real performance because I just run each benchmark three times and the platform is too old.
Platform
I conducted my all benchmarking on my notebook (I just can find this machine, which is idle). This notebook is IBM Thinkpad R51 with a 1.7GHz Intel Centrino CPU (It just have one core). It has a 1.25G DDR memory and a Hitachi 5400 RPM disk with a capacity of 60GB.
I run 3 times per benchmarking and calculate the average. 'ext2' is current implementation without preallocation. 'ext2+rsv(8)' is my implementation with reservation window, which the size of window is 8. 'ext2+rsv+dw' can dynamically increase the size of window.
uname -a
FreeBSD lz-freebsd 9.0-CURRENT FreeBSD 9.0-CURRENT #2: Fri May 28 17:31:21 CST 2010
Blogbench
blogbench -d <mountpoint>
r/w |
ext2 |
ext2+rsv(8) |
ext2+rsv+dw |
writes |
6.67 |
7.33 (10.0%) |
7.67 (15.0%) |
reads |
70437.33 |
105083 (49.19%) |
96844 (37.5%) |
Dbench
dbench -D <mountpoint> <clientnumbers>
threads |
ext2 |
ext2+rsv(8) |
ext2+rsv+dw |
1 |
33.9201 |
38.2006 (12.62%) |
61.1552 (80.29%) |
2 |
22.9775 |
22.8349 (-0.62%) |
40.4392 (75.99%) |
4 |
14.3622 |
15.1429 (5.43%) |
16.934 (17.91%) |
8 |
9.4165 |
10.9028 (15.78%) |
12.0248 (27.70%) |
16 |
6.4429 |
7.4228 (15.21%) |
7.537835 (16.99%) |
